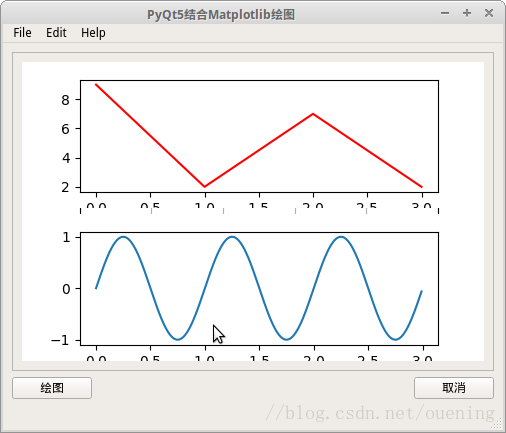
參考網上的例子,實現了簡單的matplotlib pyqt5繪圖
相關知識點:
(1)pyqt5中添加控件要在布局中添加
(2)布局可以使用replaceWidget替換控件
(3)信號與槽機制
|
1
2
3
4
|
timer = QtCore.QTimer(self)timer.timeout.connect(self.update_figure)self.btnPlot.clicked.connect(self.plotButton_callback) |
實現的效果

|
1
2
3
4
5
6
7
8
9
10
11
12
13
14
15
16
17
18
19
20
21
22
23
24
25
26
27
28
29
30
31
32
33
34
35
36
37
38
39
40
41
42
43
44
45
46
47
48
49
50
51
52
53
54
55
56
57
58
59
60
61
62
63
64
65
66
67
68
69
70
71
72
73
74
75
76
77
78
79
80
81
82
83
84
85
86
87
88
89
90
91
92
93
94
95
96
97
98
99
100
101
102
103
104
105
106
107
108
109
110
|
import sysfrom PyQt5.QtWidgets import QMainWindow, QAction, qApp, QApplication, QMessageBox, QVBoxLayout, QSizePolicy, QWidgetfrom PyQt5.QtGui import QIconfrom matplotlib.backends.backend_qt5agg import FigureCanvasQTAgg as FigureCanvasfrom matplotlib.figure import Figureimport matplotlib.pyplot as pltimport numpy as npqtCreatorFile = "matplotlib_ui.ui"# 使用uic加載Ui_MainWindow, QtBaseClass = uic.loadUiType(qtCreatorFile)class MyMplCanvas(FigureCanvas): """這是一個窗口部件,即QWidget(當然也是FigureCanvasAgg)""" def __init__(self, parent=None, width=5, height=4, dpi=100): fig = Figure(figsize=(width, height), dpi=dpi) self.axes = fig.add_subplot(111) # 每次plot()調用的時候,我們希望原來的坐標軸被清除(所以False) self.axes.hold(False) self.axes.grid('on') self.compute_initial_figure() # FigureCanvas.__init__(self, fig) self.setParent(parent) FigureCanvas.setSizePolicy(self, QSizePolicy.Expanding, QSizePolicy.Expanding) FigureCanvas.updateGeometry(self) def compute_initial_figure(self): passclass MyStaticMplCanvas(MyMplCanvas): """靜態畫布:一條正弦線""" def compute_initial_figure(self): t = np.arange(0.0, 3.0, 0.01) s = np.sin(2 * np.pi * t) self.axes.grid('on') self.axes.plot(t, s)class MyDynamicMplCanvas(MyMplCanvas): """動態畫布:每秒自動更新,更換一條折線。""" def __init__(self, *args, **kwargs): MyMplCanvas.__init__(self, *args, **kwargs) timer = QtCore.QTimer(self) timer.timeout.connect(self.update_figure) timer.start(1000) def compute_initial_figure(self): self.axes.grid('on') self.axes.plot([0, 1, 2, 3], [1, 2, 0, 4], 'r') def update_figure(self): # 構建4個隨機整數,位于閉區間[0, 10] l = [np.random.randint(0, 10) for i in range(4)] self.axes.grid('on') self.axes.plot([0, 1, 2, 3], l, 'r') self.draw()class MyApp(QMainWindow, Ui_MainWindow): def __init__(self): QMainWindow.__init__(self) Ui_MainWindow.__init__(self) super().__init__() self.initUI() self.initBtn() self.initFrame() def initFrame(self): self.main_widget = self.frame self.layout = QVBoxLayout(self.main_widget) self.f = MyMplCanvas(self.main_widget) self.layout.addWidget(self.f) def initUI(self): self.setupUi(self) self.setWindowTitle("PyQt5結合Matplotlib繪圖") self.setWindowIcon(QIcon("rocket.ico")) # 設置圖標,linux下只有任務欄會顯示圖標 self.show() def initBtn(self): self.btnPlot.clicked.connect(self.plotButton_callback) self.btnPlot.setToolTip("Button") def plotButton_callback(self): self.drawFrame() def drawFrame(self): sc = MyStaticMplCanvas(self.main_widget, width=5, height=4, dpi=100) dc = MyDynamicMplCanvas(self.f, width=5, height=4, dpi=100) self.layout.addWidget(sc) self.layout.replaceWidget(self.f,dc) # 替換控件if __name__ == '__main__': app = QApplication(sys.argv) ex = MyApp() sys.exit(app.exec_()) |
參考鏈接:https://www.cnblogs.com/hhh5460/p/4322652.html
到此這篇關于PyQt5結合matplotlib繪圖的實現示例的文章就介紹到這了,更多相關PyQt5結合matplotlib內容請搜索服務器之家以前的文章或繼續瀏覽下面的相關文章希望大家以后多多支持服務器之家!
原文鏈接:https://blog.csdn.net/ouening/article/details/79595266


