前言:最近項目里面有一些對excel操作的需求,博主想都沒想,npoi唄,簡單、開源、免費,大家都喜歡!確實,對于一些簡單的excel導入、導出、合并單元格等,它都沒啥太大的問題,但是這次的需求有兩點是npoi搞不定的:
1、導入excel后,需要切割excel的sheet頁,然后每個sheet頁單獨生成一個pdf文件。
2、導出excel的時候,項目里面需要將一些數據表格以圖表的形式在excel里面展示。
找了一圈資料,對于excel生成pdf,網上的答案千篇一律:使用com組件的方式,通過調用服務器上面的office組件里面的東西去轉。這種方式需要在服務器上面安裝office,這倒是其次,最重要的是,權限的問題很頭疼。博主已經按照這種方式實現了,調試的時候沒問題,部署到iis上面之后又出了各種權限的問題,好不容易在一臺服務器上面部署成功了,放到另一臺服務器上面按照同樣的方式部署,卻還是提示“拒絕訪問”。博主也是醉了。而對于excel生成圖表,npoi暫時沒找到實現方式,com組件的方式可以,但是實現起來略顯復雜,并且這東西龐大、不太穩定,尤其是咱們大部分人個人電腦上面裝的office都不是正版,使用起來也很麻煩。
基于此,經過一番努力,找到了這么一個第三方組件spire.xls。這兩天體驗了一把,使用起來還比較順手,在此來簡單介紹下這個組件的使用吧。
一、組件介紹
spire.xls是e-iceblue開發的一套基于企業級的專業office文檔處理的組件之一,全稱spire.office for .net。旗下有spire.doc,spire xls,spire.pdf,spire.barcode等多款專業組件,為各種office文檔在程序處理上提供了很大的方便,官方為各種功能提供了大量的在線api,簡化了使用組件的難度。組件使用時不需要本地office組件的支持。spire.office是一款企業級組件,它提供了收費版本和免費版本兩種級別,一般來說,對于個人的應用,免費版本已足夠用。比如對于上文博主遇到的問題,spire.xls組件就提供了很好的實現機制,如果你也遇到了npoi解決不了的問題,不妨試試這個。
“xls”是excel文件的后綴之一,顧名思義,spire.xls當然就是針對excel表格處理的組件嘍,本篇,博主將結合上文遇到的問題來看看spire.xls組件的強大功能。
二、組件安裝使用
對于組件的安裝,在此還是提供兩種方式:
1、官方下載安裝
下載地址。官方下載的安裝包是msi結尾的,安裝時需要選擇支持的vs版本等信息,軟件的安裝就不做過多說明,有興趣的可以下載試試。
2、nuget安裝
大家最喜歡的應該還是nuget方式吧,簡單,方便,并且易于管理。博主也是不太喜歡為了一個組件而去單獨下載一個安裝包。
spire.xls也提供了nuget的方式,只需要搜索spire,選擇免費版的組件即可:

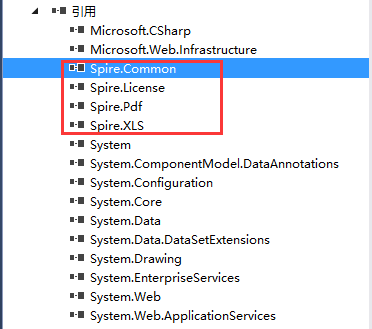
安裝完成后自動引用了需要的dll
三、組件功能介紹
關于excel的一些常用操作,比如取值、賦值、設置單元格樣式等,這里就不做過多介紹,無論是com組件、npoi還是aspose,這些都是最基礎的功能。下面就針對上文提出的幾個問題著重說明下。
1、excel轉pdf
(1)com組件實現思路回顧
關于excel轉pdf的實現,網上找到的解決方案基本一樣,大致代碼如此:
|
1
2
3
4
5
6
7
8
9
10
11
12
13
14
15
16
17
18
19
20
21
22
23
24
25
26
27
28
29
30
31
32
33
34
35
36
37
38
39
40
41
42
43
44
45
46
47
48
49
50
|
/// <summary> /// 把excel文件轉換成pdf格式文件 /// </summary> /// <param name="sourcepath">源文件路徑</param> /// <param name="targetpath">目標文件路徑</param> /// <returns>true=轉換成功</returns> public bool xlsconverttopdf(string sourcepath, string targetpath) { logger.info("開始轉pdf"); bool result = false; xlfixedformattype targettype = xlfixedformattype.xltypepdf; object missing = type.missing; microsoft.office.interop.excel.application application = null; microsoft.office.interop.excel.workbook workbook = null; try { application = new application(); application.interactive = false; object target = targetpath; object type = targettype; workbook = application.workbooks.open(sourcepath, missing, missing, missing, missing, missing, missing, missing, missing, missing, missing, missing, missing, missing, missing); application.interactive = true; workbook.exportasfixedformat(targettype, target, xlfixedformatquality.xlqualitystandard, true, false, missing, missing, missing, missing); result = true; } catch(exception ex) { logger.error("excel轉pdf異常,異常信息:" + ex.message + "。堆棧信息:" + ex.stacktrace); result = false; } finally { if (workbook != null) { workbook.close(true, missing, missing); workbook = null; } if (application != null) { application.quit(); application = null; } gc.collect(); gc.waitforpendingfinalizers(); gc.collect(); gc.waitforpendingfinalizers(); } return result; } |
這個方法需要依賴于本機上面的office com組件,如果你安裝office的時候,沒有安裝com組件相關的dll,這個方法也是用不了的,并且還有一個最大的問題就是執行application.workbooks.open(sourcepath, missing, missing, missing, missing, missing, missing, missing, missing, missing, missing, missing, missing, missing, missing);這一個方法的時候需要當前用戶有操作excel application這個組件的權限,尤其是部署到iis上面之后,需要配置一系列的權限,很是麻煩。
(2)spire.xls實現轉換
通過上文,我們知道,spire.office提供了spire.xls和spire.pdf兩個組件,那么他們之間的轉換就簡單了。我們還是模擬一個文件上傳的功能。
前端有一個上傳控件:
后臺有一個接收上傳文件的方法如下:
|
1
2
3
4
5
6
7
8
9
10
11
|
[httppost] public jsonresult uploadfile() { var strres = string.empty; var ofile = request.files["txt_file"]; workbook book = new workbook(); book.loadfromstream(ofile.inputstream); var strfullname = @"d:\data\upload\" + "first" + datetime.now.tostring("yyyymmddhhmmss") + ".pdf"; book.savetopdf(strfullname); return json(new object { }, jsonrequestbehavior.allowget); } |
就這么簡單的幾句話即可實現將上傳的excel轉成pdf文件。根據源文件生成workbook對象,spire.xls提供了多種方式,我們最常用的兩種方式如下:
|
1
2
3
4
|
// 根據文件路徑生成workbook.public void loadfromfile(string filename);// 根據文件流生成workbook.public void loadfromstream(stream stream); |
2.1、最原始的轉換
原始excel文件:

轉換成pdf之后

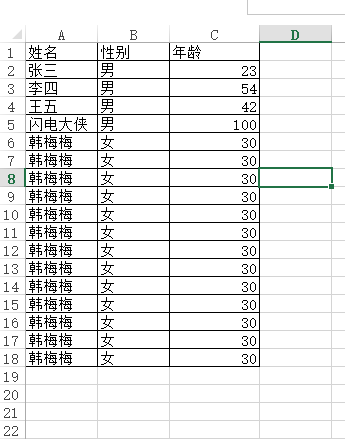
2.2、不好看?加一個邊框即可。
轉換之后

2.3、自定義轉換的pdf
有些情況下,我們excel里面有很多列,導致默認生成的pdf換行問題,這樣將會導致pdf的可讀性很差,這種情況,spire.xls為我們提供了自定義轉換pdf的方式,比如可以指定pdf的頁寬,頁高,大小等等屬性。
比如有如下excel文檔需要轉換成pdf文件:

如果按照常規的轉換,生成的pdf的寬度不足以顯示excel的所有列,于是轉換出來的效果這樣:

為了解決這種問題,組件為我們提供了如下方法:
|
1
2
3
4
5
6
7
8
9
10
11
12
13
14
15
16
17
18
19
20
21
22
|
[httppost] public jsonresult uploadfile() { var strres = string.empty; var ofile = request.files["txt_file"]; workbook book = new workbook(); book.loadfromstream(ofile.inputstream); var strfullname = @"d:\data\upload\" + "first" + datetime.now.tostring("yyyymmddhhmmss") + ".pdf"; pdfdocument pdfdocument = new pdfdocument(); pdfdocument.pagesettings.orientation = pdfpageorientation.landscape; pdfdocument.pagesettings.width = 1800;//指定pdf的寬度 pdfdocument.pagesettings.height = 1000;//指定pdf的高度 pdfconvertersettings settings = new pdfconvertersettings(); settings.templatedocument = pdfdocument; pdfconverter pdfconverter = new pdfconverter(book); pdfdocument = pdfconverter.convert(settings); pdfdocument.savetofile(strfullname); return json(new object { }, jsonrequestbehavior.allowget); } |
這樣就可以正常了,如果你的excel列更多,可以適當調整寬度和高度。得到的結果如下

還有更多強大的功能大家有興趣可以慢慢探索,官方文檔寫得還算詳細。
2.4、excel轉其他類型
除了轉為pdf,spire.xls還支持轉換為其他類型,比如常見的xml、image、html等。如果大家有這方面的需求,可以深究一下。
2、excel生成圖表
2.1、excel圖表生成原理分析
通過下面一張圖先來看看excel里面生成圖表的原理
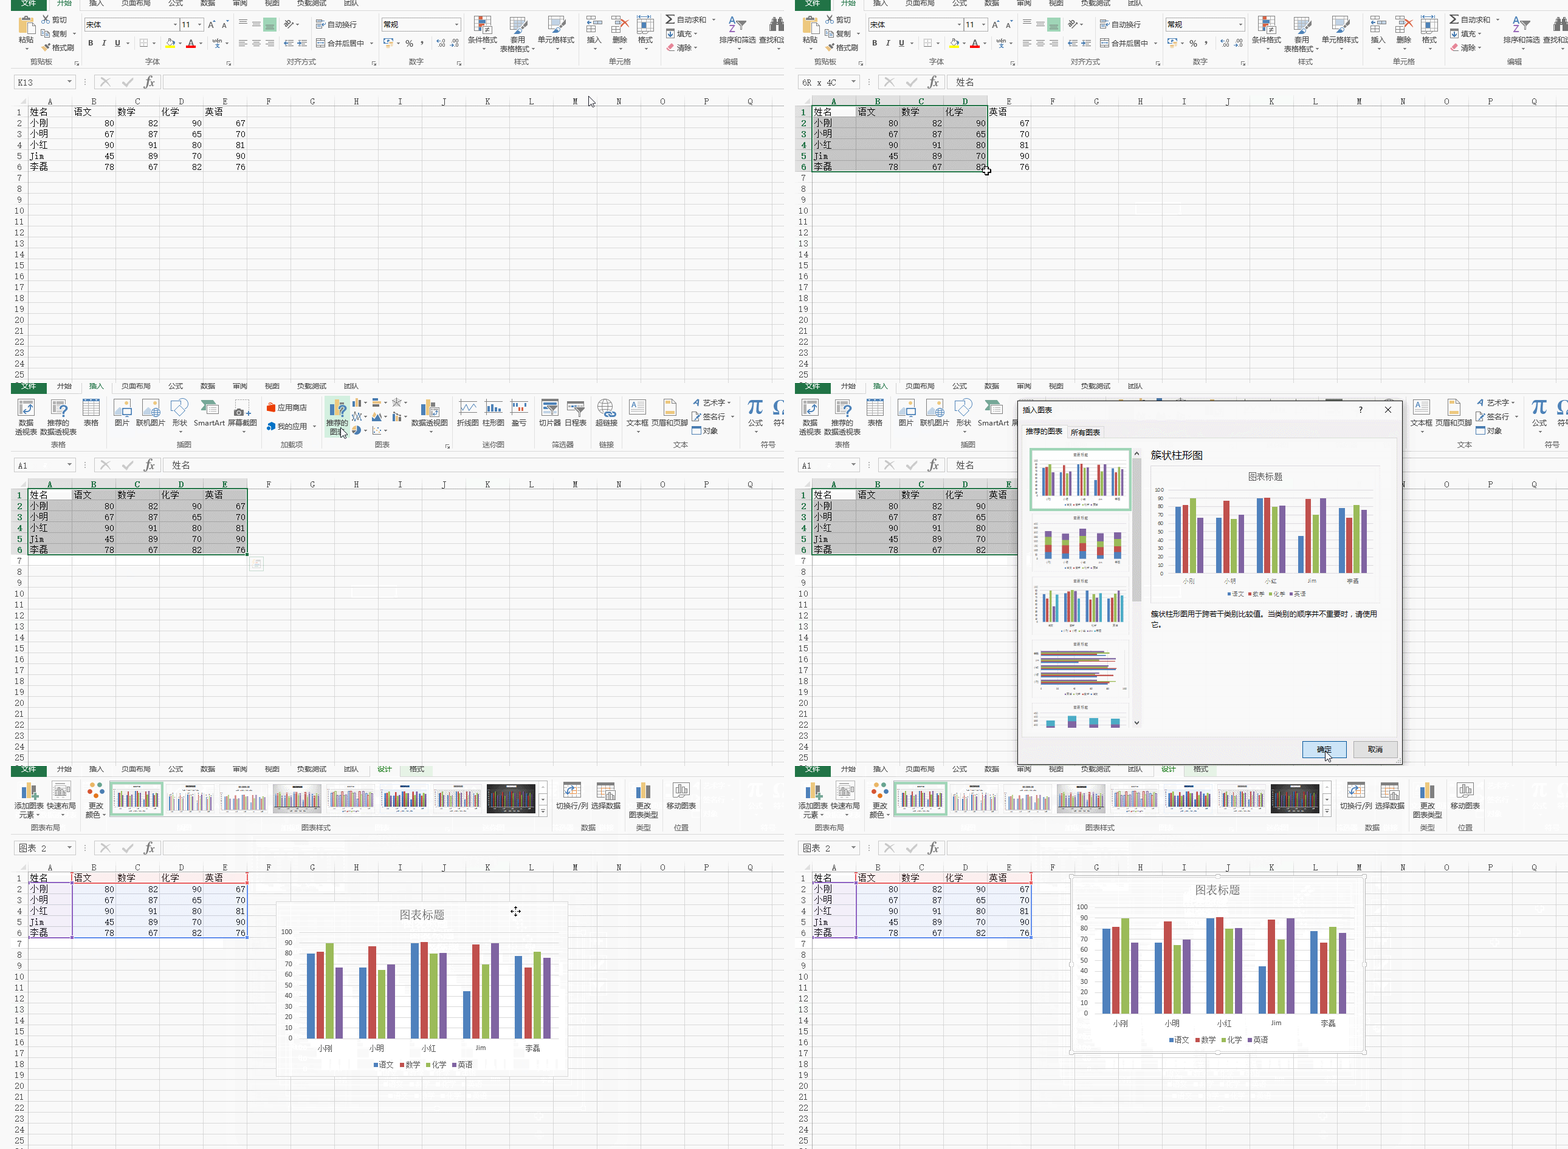
通過這張圖我們可以看到,excel生成圖表首先需要當前文檔里面存在數據表格,然后選中相應的數據表格,最后選擇生成的圖表類型,excel應用會自動幫你生成相應的數據圖表。
2.2、spire.xls生成簡單圖表
知道了上面excel生成圖表的原理,我們再來看看spire.xls組件如何幫助我們解決生成圖表的問題。關于生成圖表,spire.xls組件提供了很多的選擇,覆蓋了excel里面各種自帶的圖表類型、統計方法等。下面先來看一個簡單點的例子。
|
1
2
3
4
5
6
7
8
9
10
11
12
13
14
15
16
17
18
19
20
21
22
23
24
25
26
27
28
29
30
31
32
33
34
35
36
37
38
39
40
41
42
43
44
45
46
47
48
49
50
51
52
53
54
55
56
57
58
59
60
61
62
63
64
65
66
67
68
69
70
71
|
[httppost] public jsonresult exportdata() { try { workbook book = new workbook(); worksheet sheet = book.worksheets[0]; var random = new random(); var icellcount = 1; //1.設置表頭 sheet.range[1, icellcount++].text = "部門名稱"; sheet.range[1, icellcount++].text = "部門人數"; var lstdeptname = new list<string>() { "市場部", "策劃部", "公關部", "行政部", "開發部" }; var a = 0; //2.構造表數據 for (var i = 2; i < 7; i++) { icellcount = 1; sheet.range[i, icellcount++].text = lstdeptname[a++]; sheet.range[i, icellcount++].numbervalue = random.next(1, 100); ; } //3.生成圖表 setchart(sheet, excelcharttype.barclustered);var strfullname = @"d:\data\upload\" + "export" + datetime.now.tostring("yyyymmddhhmmss") + ".xlsx"; book.savetofile(strfullname, excelversion.version2010); } catch (exception ex) { } return json(true, jsonrequestbehavior.allowget); } private void setchart(worksheet sheet, excelcharttype chartformat) { //1.設置sheet頁的名稱 sheet.name = "chart data"; sheet.gridlinesvisible = false; chart chart = sheet.charts.add(); //2.指定生成圖表的區域 chart.datarange = sheet.range["a1:b6"]; chart.seriesdatafromrange = false; //3.指定圖表的所在位置 chart.leftcolumn = 5; chart.toprow = 2; chart.rightcolumn = 11; chart.bottomrow = 29; chart.charttype = chartformat; //4.設置圖表的名稱以及x、y軸的名稱 chart.charttitle = "部門信息"; chart.charttitlearea.isbold = true; chart.charttitlearea.size = 12; chart.primarycategoryaxis.title = "部門"; chart.primarycategoryaxis.font.isbold = true; chart.primarycategoryaxis.titlearea.isbold = true; chart.primaryvalueaxis.title = "人數"; chart.primaryvalueaxis.hasmajorgridlines = false; chart.primaryvalueaxis.titlearea.textrotationangle = 90; chart.primaryvalueaxis.minvalue = 0; chart.primaryvalueaxis.titlearea.isbold = true; //5.設置圖表的值 spire.xls.charts.chartserie cs = chart.series[0]; cs.categorylabels = sheet.range["a2:a6"]; cs.values = sheet.range["b2:b6"]; cs.dataformat.showactivevalue = true; chart.legend.position = legendpositiontype.top; } |
通過以上一段代碼得到的excel內容如下:
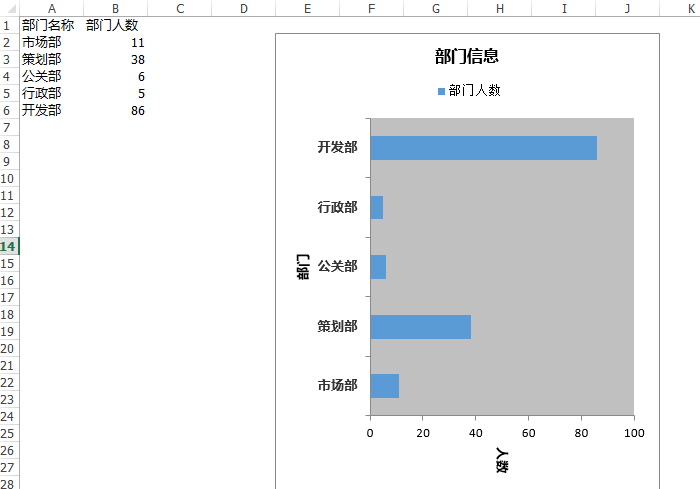
代碼釋疑:關于上面的代碼不難,但還是想做些簡單的說明。
首先填充表格數據,spire.xls讀寫數據表格使用的是sheet.range[i, icellcount++].text這種方式。值得一提的是這里的行列索引都是從1開始的。range除了提供行列索引的方式,還提供了range["b1"].text這種方式去讀取值。
通過上文excel生成圖表原理我們知道,出了有數據表格,還得選中生成圖表的區域,上述代碼里面通過chart.datarange = sheet.range["a1:b6"];這一句去指定區域,和excel里面的操作方式保持一致。
通過chart.charttype = chartformat;來指定需要生成的圖表類型,spire.xls里面通過一個枚舉類型包含了各種圖表類型。
除了上面的這些,組件還支持指定圖表在文檔中的位置、圖表坐標的最大值最小值。并且能夠通過
這種方式去指定分類和值的區域,更加符合excel的操作習慣。當然,如無特殊,這些完全可以不用指定。
2.3、對兩項或者多項進行統計
上面只是一個最簡單的例子,如果要對多列進行統計呢?我們繼續來看這個例子,我們將代碼改成這樣:
|
1
2
3
4
5
6
7
8
9
10
11
12
13
14
15
16
17
18
19
20
21
22
23
24
25
26
27
28
29
30
31
32
33
34
35
36
37
38
39
40
41
42
43
44
45
46
47
48
49
50
51
52
53
54
55
56
57
58
59
60
61
62
63
64
65
66
67
68
69
70
71
72
73
|
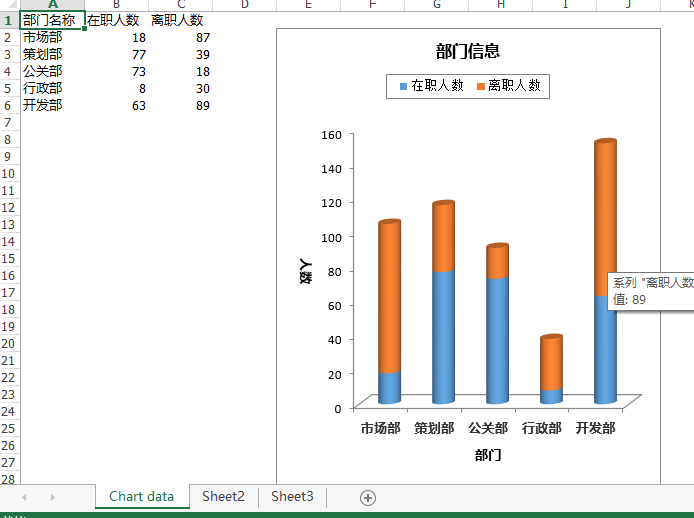
[httppost] public jsonresult exportdata() { try { workbook book = new workbook(); worksheet sheet = book.worksheets[0]; var random = new random(); var icellcount = 1; //1.設置表頭 sheet.range[1, icellcount++].text = "部門名稱"; sheet.range[1, icellcount++].text = "在職人數"; sheet.range[1, icellcount++].text = "離職人數"; var lstdeptname = new list<string>() { "市場部", "策劃部", "公關部", "行政部", "開發部" }; var a = 0; //2.構造表數據 for (var i = 2; i < 7; i++) { icellcount = 1; sheet.range[i, icellcount++].text = lstdeptname[a++]; sheet.range[i, icellcount++].numbervalue = random.next(1, 100); sheet.range[i, icellcount++].numbervalue = random.next(1, 100); ; }//3.生成圖表 setchart(sheet, excelcharttype.barclustered); var strfullname = @"d:\data\upload\" + "export" + datetime.now.tostring("yyyymmddhhmmss") + ".xlsx"; book.savetofile(strfullname, excelversion.version2010); } catch (exception ex){} return json(true, jsonrequestbehavior.allowget); } private void setchart(worksheet sheet, excelcharttype chartformat) { //1.設置sheet頁的名稱 sheet.name = "chart data"; sheet.gridlinesvisible = false; chart chart = sheet.charts.add(); //2.指定生成圖表的區域 chart.datarange = sheet.range["a1:c6"]; chart.seriesdatafromrange = false; //3.指定圖表的所在位置 chart.leftcolumn = 5; chart.toprow = 2; chart.rightcolumn = 11; chart.bottomrow = 29; chart.charttype = chartformat; //4.設置圖表的名稱以及x、y軸的名稱 chart.charttitle = "部門信息"; chart.charttitlearea.isbold = true; chart.charttitlearea.size = 12; chart.primarycategoryaxis.title = "部門"; chart.primarycategoryaxis.font.isbold = true; chart.primarycategoryaxis.titlearea.isbold = true; chart.primaryvalueaxis.title = "人數"; chart.primaryvalueaxis.hasmajorgridlines = false; chart.primaryvalueaxis.titlearea.textrotationangle = 90; chart.primaryvalueaxis.minvalue = 0; chart.primaryvalueaxis.titlearea.isbold = true; //5.設置圖表的值 spire.xls.charts.chartserie cs = chart.series[0]; cs.dataformat.showactivevalue = true; cs.dataformat.showbubble = true; chart.legend.position = legendpositiontype.top; } |
得到結果如下:
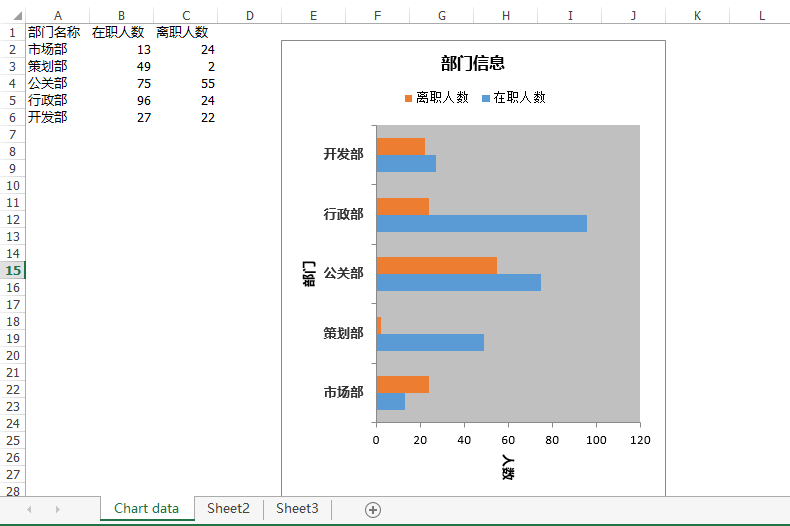
這里唯一的變化是數據區域,只要指定我們需要生成圖表的區域是哪部分,excel會自動進行計算并生成圖表。
2.4、各種類型的圖表展示
上文說過,chart.charttype = chartformat;這一句可以設置圖表的類型,在spire.xls里面定義了一系列的圖表類型:
amespace spire.xls
|
1
2
3
4
5
6
7
8
9
10
11
12
13
14
15
16
17
18
19
20
21
22
23
24
25
26
27
28
29
30
31
32
33
34
35
36
37
38
39
40
41
42
43
44
45
46
47
48
49
50
51
52
53
54
55
56
57
58
59
60
61
62
63
64
65
66
67
68
69
70
71
72
73
74
75
76
77
78
79
80
81
82
83
84
85
86
87
88
89
90
91
92
93
94
95
96
97
98
99
100
101
102
103
104
105
106
107
108
109
110
111
112
113
114
115
116
117
118
119
120
121
122
123
124
125
126
127
128
129
130
131
132
133
134
135
136
137
138
139
140
141
142
143
144
145
146
147
148
149
150
151
152
153
154
155
156
157
158
159
160
161
162
163
164
165
166
167
168
169
170
171
172
173
174
175
176
177
178
179
180
181
182
183
184
185
186
187
188
189
190
191
192
193
194
195
196
197
198
199
200
201
202
203
204
205
206
207
208
209
210
211
212
213
214
215
216
217
218
219
220
221
222
223
224
225
226
227
228
229
230
231
232
233
234
235
236
237
238
239
240
241
242
243
244
245
246
247
248
249
250
251
252
253
254
255
256
257
258
259
260
261
262
263
264
265
266
267
268
269
270
271
272
273
274
275
276
277
278
279
280
281
282
283
284
285
286
287
288
289
290
291
292
293
294
295
296
297
298
299
300
301
302
|
{ // 摘要: // chart types. public enum excelcharttype { // 摘要: // represents the column clustered chart type. columnclustered = 0, // // 摘要: // represents the stacked column chart type. columnstacked = 1, // // 摘要: // represents the 100% stacked column chart type. column100percentstacked = 2, // // 摘要: // represents the 3d clustered column chart type. column3dclustered = 3, // // 摘要: // represents the 3d stacked column chart type. column3dstacked = 4, // // 摘要: // represents the 3d 100% stacked column chart type. column3d100percentstacked = 5, // // 摘要: // represents the 3d column chart type. column3d = 6, // // 摘要: // represents the clustered bar chart type. barclustered = 7, // // 摘要: // represents the stacked bar chart type. barstacked = 8, // // 摘要: // represents the 100% stacked bar chart type. bar100percentstacked = 9, // // 摘要: // represents the 3d clustered bar chart type. bar3dclustered = 10, // // 摘要: // represents the 3d stacked bar chart type. bar3dstacked = 11, // // 摘要: // represents the 100% 3d stacked bar chart type. bar3d100percentstacked = 12, // // 摘要: // represents the line chart type. line = 13, // // 摘要: // represents the stacked line chart type. linestacked = 14, // // 摘要: // represents the 100% stacked line chart type. line100percentstacked = 15, // // 摘要: // represents the markers line chart type. linemarkers = 16, // // 摘要: // represents the stacked markers line chart type. linemarkersstacked = 17, // // 摘要: // represents the 100% stacked markers line chart type. linemarkers100percentstacked = 18, // // 摘要: // represents the 3d line chart type. line3d = 19, // // 摘要: // represents the pie chart type. pie = 20, // // 摘要: // represents the 3d pie chart type. pie3d = 21, // // 摘要: // represents the pie of pie chart type. pieofpie = 22, // // 摘要: // represents the exploded pie chart type. pieexploded = 23, // // 摘要: // represents the 3d exploded pie chart type. pie3dexploded = 24, // // 摘要: // represents the bar pie chart type. piebar = 25, // // 摘要: // represents the markers scatter chart type. scattermarkers = 26, // // 摘要: // represents the scattersmoothedlinemarkers chart type. scattersmoothedlinemarkers = 27, // // 摘要: // represents the scattersmoothedline chart type. scattersmoothedline = 28, // // 摘要: // represents the scatterlinemarkers chart type. scatterlinemarkers = 29, // // 摘要: // represents the scatterline chart type. scatterline = 30, // // 摘要: // represents the area chart type. area = 31, // // 摘要: // represents the areastacked chart type. areastacked = 32, // // 摘要: // represents the area100percentstacked chart type. area100percentstacked = 33, // // 摘要: // represents the area3d chart type. area3d = 34, // // 摘要: // represents the area3dstacked chart type. area3dstacked = 35, // // 摘要: // represents the area3d100percentstacked chart type. area3d100percentstacked = 36, // // 摘要: // represents the doughnut chart type. doughnut = 37, // // 摘要: // represents the doughnutexploded chart type. doughnutexploded = 38, // // 摘要: // represents the radar chart type. radar = 39, // // 摘要: // represents the radarmarkers chart type. radarmarkers = 40, // // 摘要: // represents the radarfilled chart type. radarfilled = 41, // // 摘要: // represents the surface3d chart type. surface3d = 42, // // 摘要: // represents the surface3dnocolor chart type. surface3dnocolor = 43, // // 摘要: // represents the surfacecontour chart type. surfacecontour = 44, // // 摘要: // represents the surfacecontournocolor chart type. surfacecontournocolor = 45, // // 摘要: // represents the bubble chart type. bubble = 46, // // 摘要: // represents the bubble3d chart type. bubble3d = 47, // // 摘要: // represents the stockhighlowclose chart type. stockhighlowclose = 48, // // 摘要: // represents the stockopenhighlowclose chart type. stockopenhighlowclose = 49, // // 摘要: // represents the stockvolumehighlowclose chart type. stockvolumehighlowclose = 50, // // 摘要: // represents the stockvolumeopenhighlowclose chart type. stockvolumeopenhighlowclose = 51, // // 摘要: // represents the cylinderclustered chart type. cylinderclustered = 52, // // 摘要: // represents the cylinderstacked chart type. cylinderstacked = 53, // // 摘要: // represents the cylinder100percentstacked chart type. cylinder100percentstacked = 54, // // 摘要: // represents the cylinderbarclustered chart type. cylinderbarclustered = 55, // // 摘要: // represents the cylinderbarstacked chart type. cylinderbarstacked = 56, // // 摘要: // represents the cylinderbar100percentstacked chart type. cylinderbar100percentstacked = 57, // // 摘要: // represents the cylinder3dclustered chart type. cylinder3dclustered = 58, // // 摘要: // represents the coneclustered chart type. coneclustered = 59, // // 摘要: // represents the conestacked chart type. conestacked = 60, // // 摘要: // represents the cone100percentstacked chart type. cone100percentstacked = 61, // // 摘要: // represents the conebarclustered chart type. conebarclustered = 62, // // 摘要: // represents the conebarstacked chart type. conebarstacked = 63, // // 摘要: // represents the conebar100percentstacked chart type. conebar100percentstacked = 64, // // 摘要: // represents the cone3dclustered chart type. cone3dclustered = 65, // // 摘要: // represents the pyramidclustered chart type. pyramidclustered = 66, // // 摘要: // represents the pyramidstacked chart type. pyramidstacked = 67, // // 摘要: // represents the pyramid100percentstacked chart type. pyramid100percentstacked = 68, // // 摘要: // represents the pyramidbarclustered chart type. pyramidbarclustered = 69, // // 摘要: // represents the pyramidbarstacked chart type. pyramidbarstacked = 70, // // 摘要: // represents the pyramidbar100percentstacked chart type. pyramidbar100percentstacked = 71, // // 摘要: // represents the pyramid3dclustered chart type. pyramid3dclustered = 72, // // 摘要: // represents the combinationchart chart types. combinationchart = 73, }} |
我們來看看一些比較常見的圖表
2.4.1、餅狀圖
excelcharttype.pie
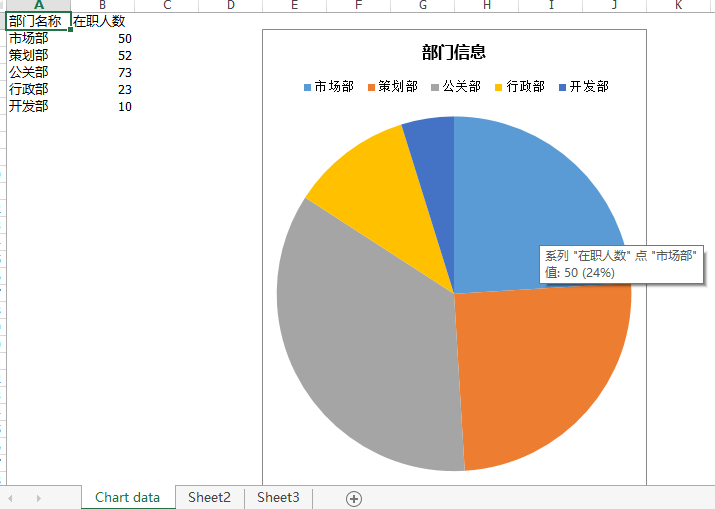
excelcharttype.pie3d
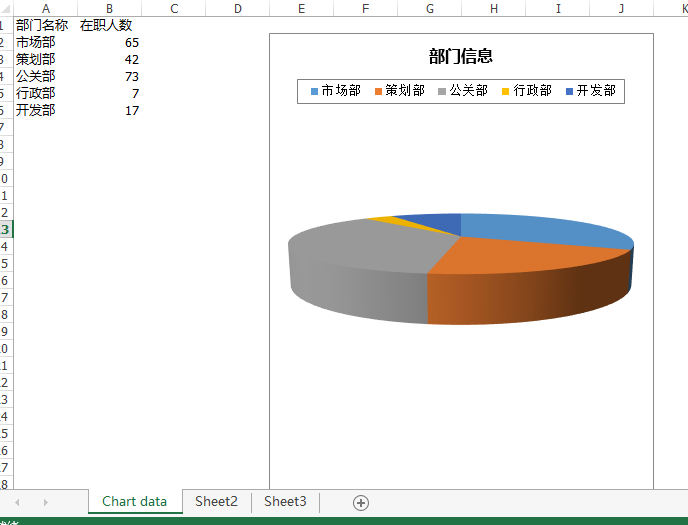
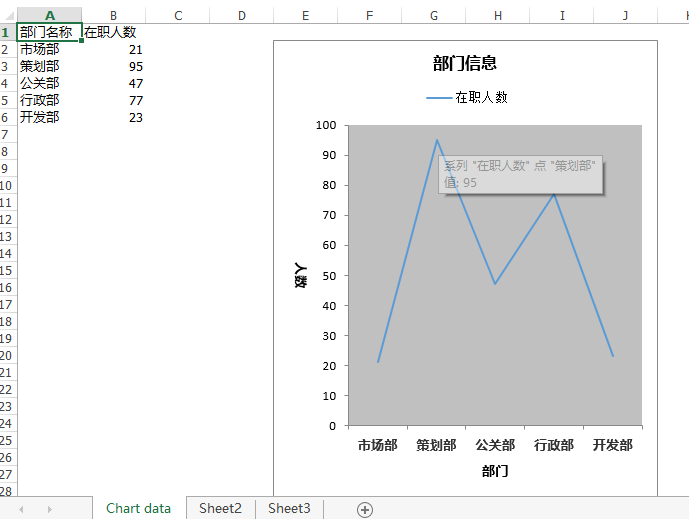
2.4.2、連線圖
excelcharttype.line3d

excelcharttype.linestacked
2.4.3、區域圖


2.4.4、雷達圖

2.4.5、圓形柱狀圖
3、其他功能介紹
關于spire.xls的其他亮點功能,博主也還在研究,已經知道的一些常用功能比如(1)支持單元格合并、凍結、注釋;(2)數據庫方式的導入導出;(3)sheet頁的復制、切割、顯示、隱藏等;(4)頁眉頁腳的設置;(5)數據的分組、排序;(6)像excel插入圖片,設置圖片樣式等。這些功能有些已經實現,有些還在研究,等以后有機會再發出來供大家參考。因為篇幅問題,這篇先到這里吧。
四、總結
以上簡單總結了下spire.xls組件幾個特色功能,很好的解決了博主遇到的問題,博主覺得在一定程度上,spire.xls組件能擬補npoi、com組件的部分不足。還有很多其他特色功能待以后整理之后連帶測試demo一起發出。如果你也遇到一些其他組件解決不了的問題,不妨試試它,或許會帶給你驚喜。當然,如果本文能夠幫到你,還是希望園友們幫忙推薦,博主下次繼續努力!
以上就是本文的全部內容,希望對大家的學習有所幫助,也希望大家多多支持服務器之家。
原文鏈接:http://www.cnblogs.com/landeanfen/p/5888973.html


