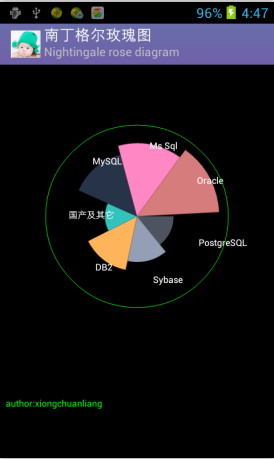
南丁格爾玫瑰圖 在常規圖表中實在很驚艷,但我初看沒看懂,一查原來南丁格爾這么偉大,確實值得尊敬。
再仔細研究了下這種圖的構成,發現原來就是把柱形圖的柱形換成了扇形圖的半徑來表示,當然,變種有好多,我這只是說我理解的這種。
知道了其構成方式后就好實現了,依傳入參數個數決定其扇形角度,依百分比決定其扇形的半徑長度,然后就一切都水到渠成了。
漂亮的美圖獻上:

附上實現代碼:
|
1
2
3
4
5
6
7
8
9
10
11
12
13
14
15
16
17
18
19
20
21
22
23
24
25
26
27
28
29
30
31
32
33
34
35
36
37
38
39
40
41
42
43
44
45
46
47
48
49
50
51
52
53
54
55
56
57
58
59
60
61
62
63
64
65
66
67
68
69
70
71
72
73
74
75
76
77
78
79
80
81
82
83
84
85
86
87
88
89
90
91
92
93
94
95
96
97
98
99
100
101
102
103
104
105
106
107
108
109
110
111
112
113
114
115
116
117
118
|
package com.xcl.chart;/** * canvas練習 * 自已畫南丁格爾玫瑰圖(nightingale rose diagram) * * author:xiongchuanliang * date:2014-4-12 */import android.content.context;import android.graphics.canvas;import android.graphics.color;import android.graphics.paint;import android.graphics.paint.style;import android.graphics.rectf;import android.util.displaymetrics;import android.view.view;public class panelrosechart extends view{ private int scrwidth,scrheight; //演示用的百分比例,實際使用中,即為外部傳入的比例參數 private final float arrper[] = new float[]{40f,50f,60f,35f,70f,80f,90f}; //演示用標簽 private final string arrperlabel[] = new string[]{"postgresql","sybase","db2","國產及其它","mysql","ms sql","oracle"}; //rgb顏色數組 private final int arrcolorrgb[][] = { {77, 83, 97}, {148, 159, 181}, {253, 180, 90}, {52, 194, 188}, {39, 51, 72}, {255, 135, 195}, {215, 124, 124}} ; public panelrosechart(context context) { super(context); // todo auto-generated constructor stub //屏幕信息 displaymetrics dm = getresources().getdisplaymetrics(); scrheight = dm.heightpixels; scrwidth = dm.widthpixels; } public void ondraw(canvas canvas){ //畫布背景 canvas.drawcolor(color.black); float cirx = scrwidth / 2; float ciry = scrheight / 3 ; float radius = scrheight / 5 ;//150; float arcleft = cirx - radius; float arctop = ciry - radius ; float arcright = cirx + radius ; float arcbottom = ciry + radius ; rectf arcrf0 = new rectf(arcleft ,arctop,arcright,arcbottom); //畫筆初始化 paint paintarc = new paint(); paint paintlabel = new paint(); paintlabel.setcolor(color.white); paintlabel.settextsize(16); paintlabel.setantialias(true); paintarc.setantialias(true); //位置計算類 xchartcalc xcalc = new xchartcalc(); float percentage = 0.0f; float currper = 0.0f; float newraidus = 0.0f; int i= 0; //將百分比轉換為扇形半徑長度 percentage = 360 / arrper.length; percentage = (float)(math.round(percentage *100))/100; for(i=0; i<arrper.length; i++) { //將百分比轉換為新扇區的半徑 newraidus = radius * (arrper[i]/ 100); newraidus = (float)(math.round(newraidus *100))/100; float newarcleft = cirx - newraidus; float newarctop = ciry - newraidus ; float newarcright = cirx + newraidus ; float newarcbottom = ciry + newraidus ; rectf newarcrf = new rectf(newarcleft ,newarctop,newarcright,newarcbottom); //分配顏色 paintarc.setargb(255,arrcolorrgb[i][0], arrcolorrgb[i][1], arrcolorrgb[i][2]); //在餅圖中顯示所占比例 canvas.drawarc(newarcrf, currper, percentage, true, paintarc); //計算百分比標簽 xcalc.calcarcendpointxy(cirx, ciry, radius - radius/2/2, currper + percentage/2); //標識 canvas.drawtext(arrperlabel[i],xcalc.getposx(), xcalc.getposy() ,paintlabel); //下次的起始角度 currper += percentage; } //外環 paintlabel.setstyle(style.stroke); paintlabel.setcolor(color.green); canvas.drawcircle(cirx,ciry,radius,paintlabel); canvas.drawtext("author:xiongchuanliang", 10, scrheight - 200, paintlabel); }} |
代碼實現起來很容易,但這種圖的設計創意確實非常好。 嘆服。
一定要附上南丁格爾維基百科的鏈接: http://zh.wikipedia.org/wiki/%e5%bc%97%e7%be%85%e5%80%ab%e6%96%af%c2%b7%e5%8d%97%e4%b8%81%e6%a0%bc%e7%88%be
感興趣的可以看看。


